Organizing the Quantitative Empirical Data Analysis Elective

Reading this, you probably know that the CDTM is a student-run organization. As such it heavily depends on Centerlings to create educational offerings within the center.
Recently, we (that is Laura Steinke from class Fall 2019 and Max Mynter from class Spring 2019) went through this experience and organized the elective ‘Quantitative Empirical Data Analysis’.
With this blogpost we want to achieve two things: first, give you an insight into how organizing an elective at the CDTM works and secondly, tell about the insights we gained during the elective itself.
Elective Organization
Organizing an elective is one of the opportunities the CDTM offers. If there is a topic you as a Centerling are interested in, you can take the initiative and organize an elective to learn about a new topic and simultaneously enable your peers to do the same.
So, what is the process to organise an elective?
First, of course, you need a topic and subsequently, you have to collect signatures. This is to ensure that enough Centerlings are interested in the same topic such that the hardships involved in the organization get rewarded with high attendance.
Once this is done you have to design an interesting curriculum. For us this included brainstorming and asking ourselves what we wanted to get out of the elective. It is important to note that you do not need to be an expert in the field.
In our case, we prior exposure to empirical data analysis and verifying hypotheses and models quantitatively in our studies of physics and social sciences (Max) and business administration (Laura) as well as in several working student positions. What we were less experienced in was how to derive recommended actions from data. Additionally, we wanted to learn new tools, especially how to analyse data with python, which we subsequently can apply in our studies, jobs and other projects.
This is how we came up with a three-fold structure for the elective. On the one hand, we would have input sessions providing theoretical background knowledge and industry case studies. Additionally, we incorporated a MOOC into the curriculum. This online course covered statistical intuition and introduced python as a tool for data analysis. Thirdly, we conducted original research to apply what we have learned.
Selecting the MOOC was a surprising amount of work since we had to familiarize ourselves with the contents of different courses and therefore complete substantial parts of each candidate. On the other hand, we learned a lot during this exercise.
Additionally, we had to discuss the contents and potential speakers for the four input sessions, subsequently convince them to participate in our elective and match schedules.
We also wrote a syllabus about our elective such that people are informed about its contents and can sign up for the elective.
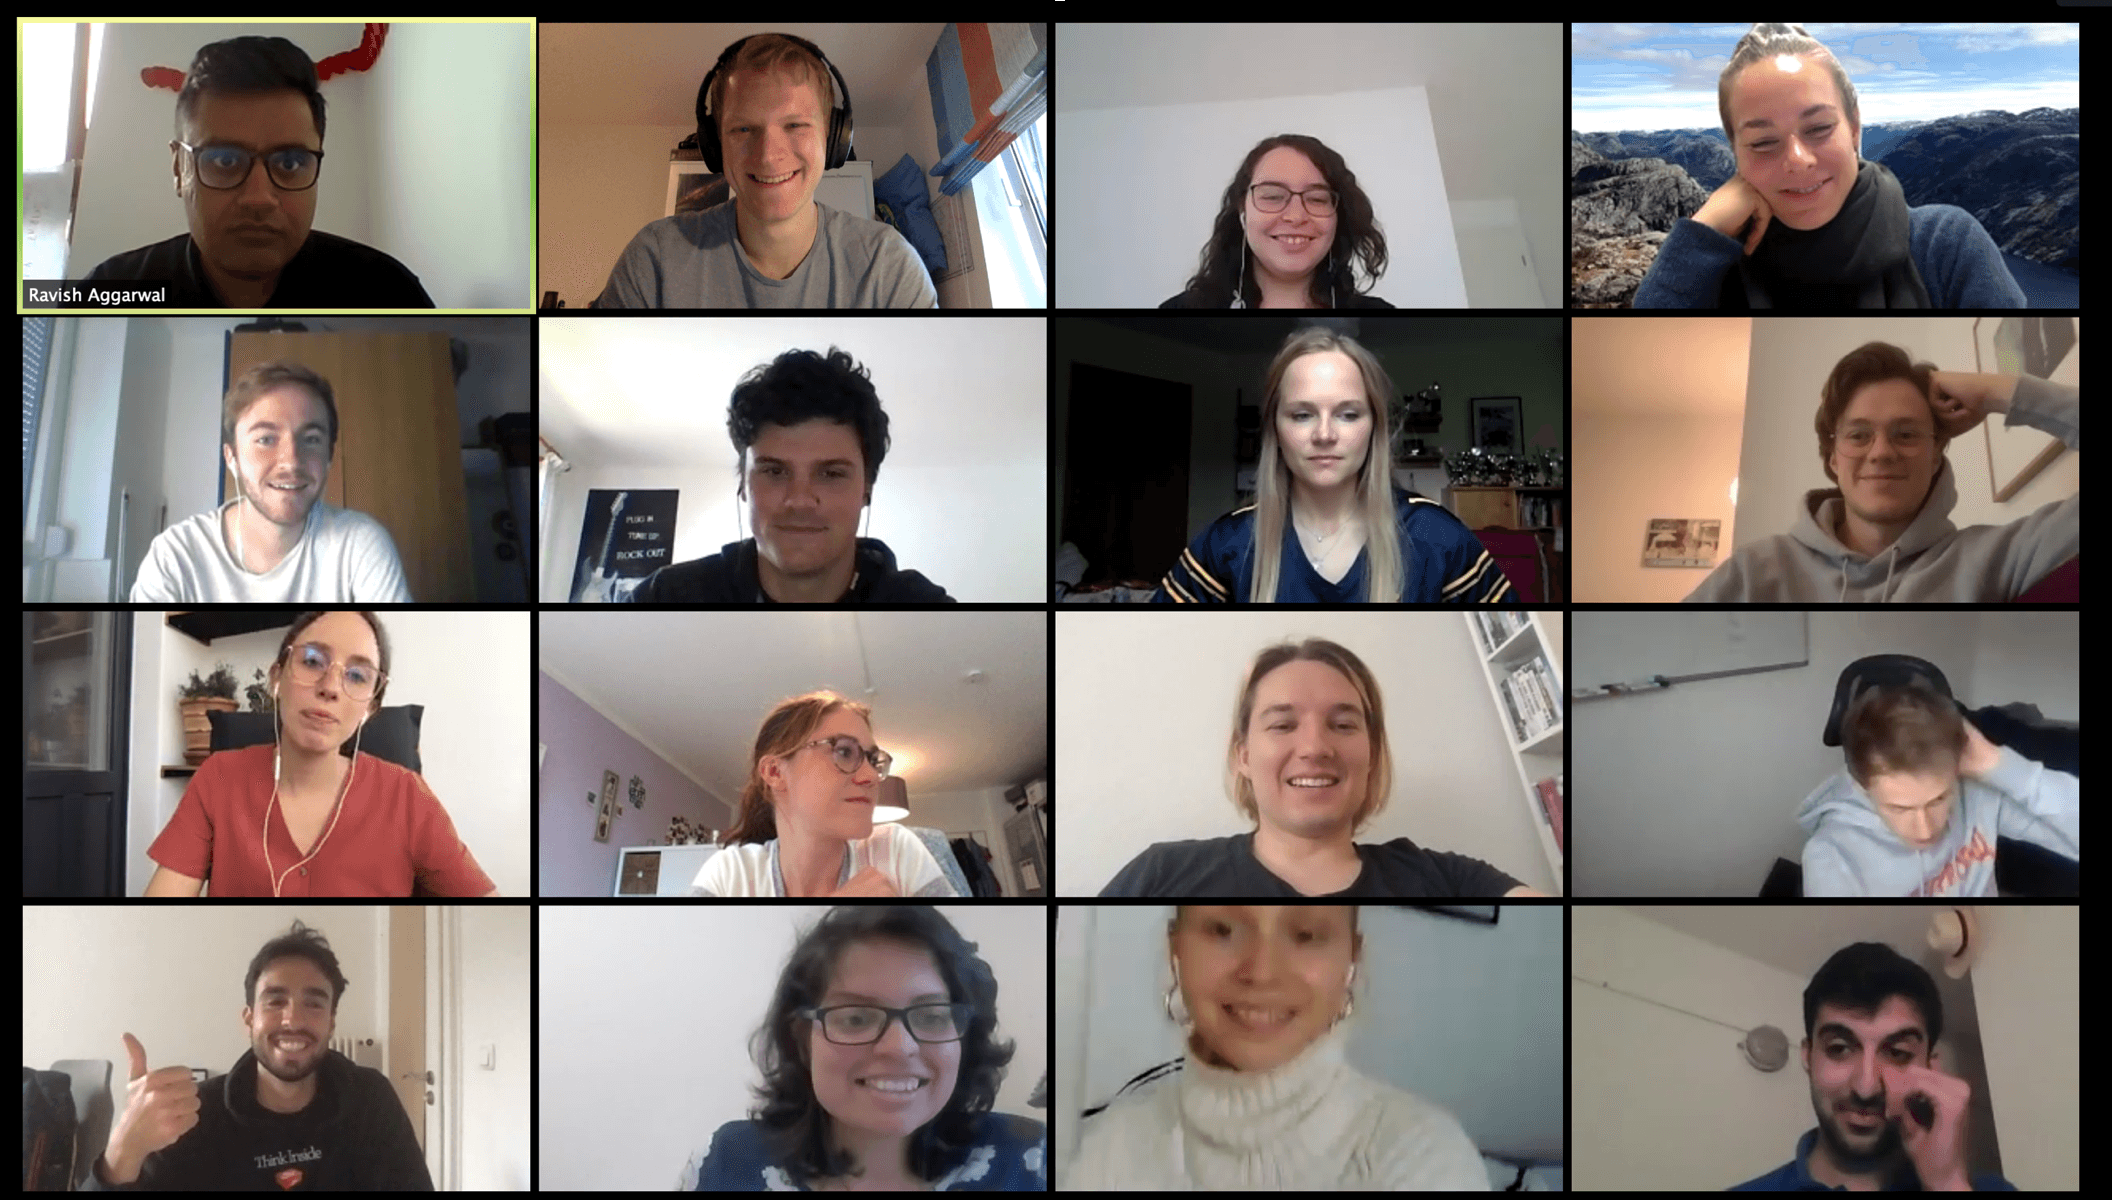
In the end, we were very happy with the turnout of 16 Centerlings within our elective.
So, what was our elective about?
The increasing abundance of data is a key symptom of the world's digitization since the early nineties. This data can be used to guide decisions, gain insights, and measure progress. As such making sense of data is in the core of technology management and is a perfect extension to the CDTM.
In the end, we had four lectures. The first one covered the philosophy behind research and the design of measuring instruments such as questionnaires held by Nicholas Folger from TU Munich.
The second lecture was a hands-on workshop on how to scrape data from the web using crawling with python. As an expert we invited the former Centerling Jörg Claussen, who is now a Professor at LMU Munich, to guide the participants through a crawling project.
Besides to these lectures, we completed an online course that covered the basics of statistical thinking and was additionally introducing python as a tool for data analysis.
In the third and fourth lectures, we saw these tools in action as we discussed industry case studies with lecturers from IBM, E.ON, and from another former Centerling, Lukas Kondmann, who is now teaching as PhD candidate at the TU Munich.
During the course the students conducted a proper data analysis project and could choose the topics on their own. Thereby, they applied what they have learned themselves. Every Centerling chose a dataset, developed hypotheses, examined their data and then presented findings in the class. We were amazed by the variety of different topics they came up with as they ranged from analysing relationships between Covid-19 death rates and poverty to finding similarities between NBA players. To give you a glimpse of the presentations, here two examples from Christoph Berger and Tosca Baroth and Xavi Oliva:
We had much fun hearing all the interesting guest lectures as well as the pitches and presentations of the Centerlings and learned also a lot for ourselves.

In the end, we can recommend organizing an elective for the CDTM community, if you have the chance. You will learn a lot, not only about the topic at hand but also during organization and execution.
We want to use this opportunity to say thank you to Nicholas Folger (TU Munich), Prof. Jörg Claussen (LMU Munich and CDTM), Alexander Reiss (IBM), Ravish Aggarwal (E.ON) and Lukas Kondmann (TU Munich and CDTM) for supporting us in holding this elective!
-------------------------------------------------